
Plot with PlotMe
Step 1 - Load Data
Load built in data using Select Data or load data from CSV file in a local drive using Load Data from CSV file.
Step 2 - Choose Axis Variables
Choose X and Y axis variables using X-Variable & Y-Variable . You'll see all columns appear as options to select from. For example, you want to see Population Growth of USA by Year. Your X-Variable will be the Year and Y-Variable will be the Number of People in USA.
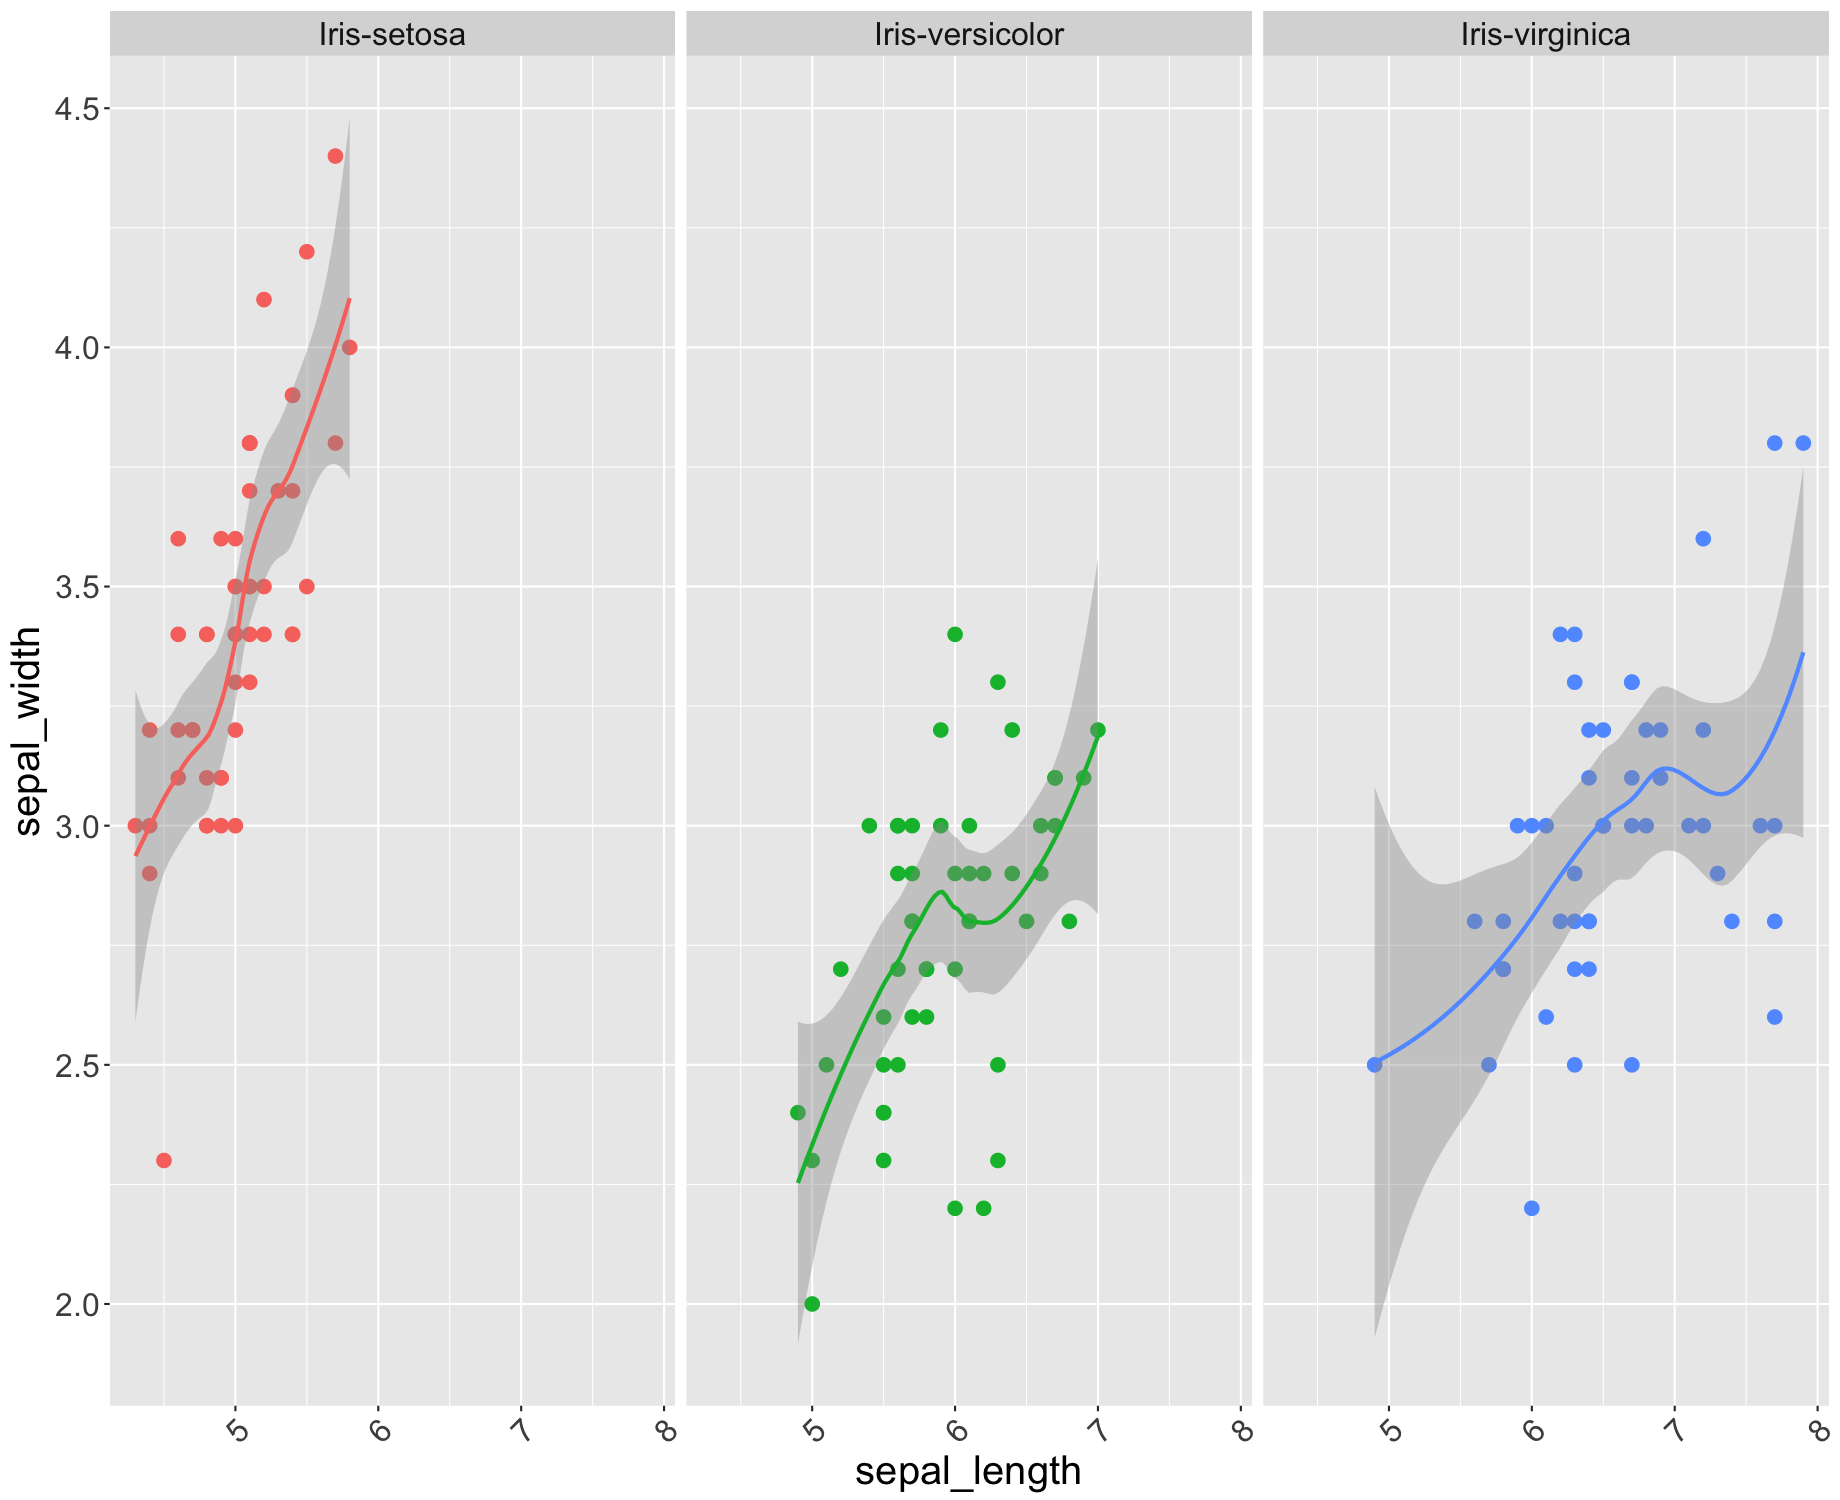
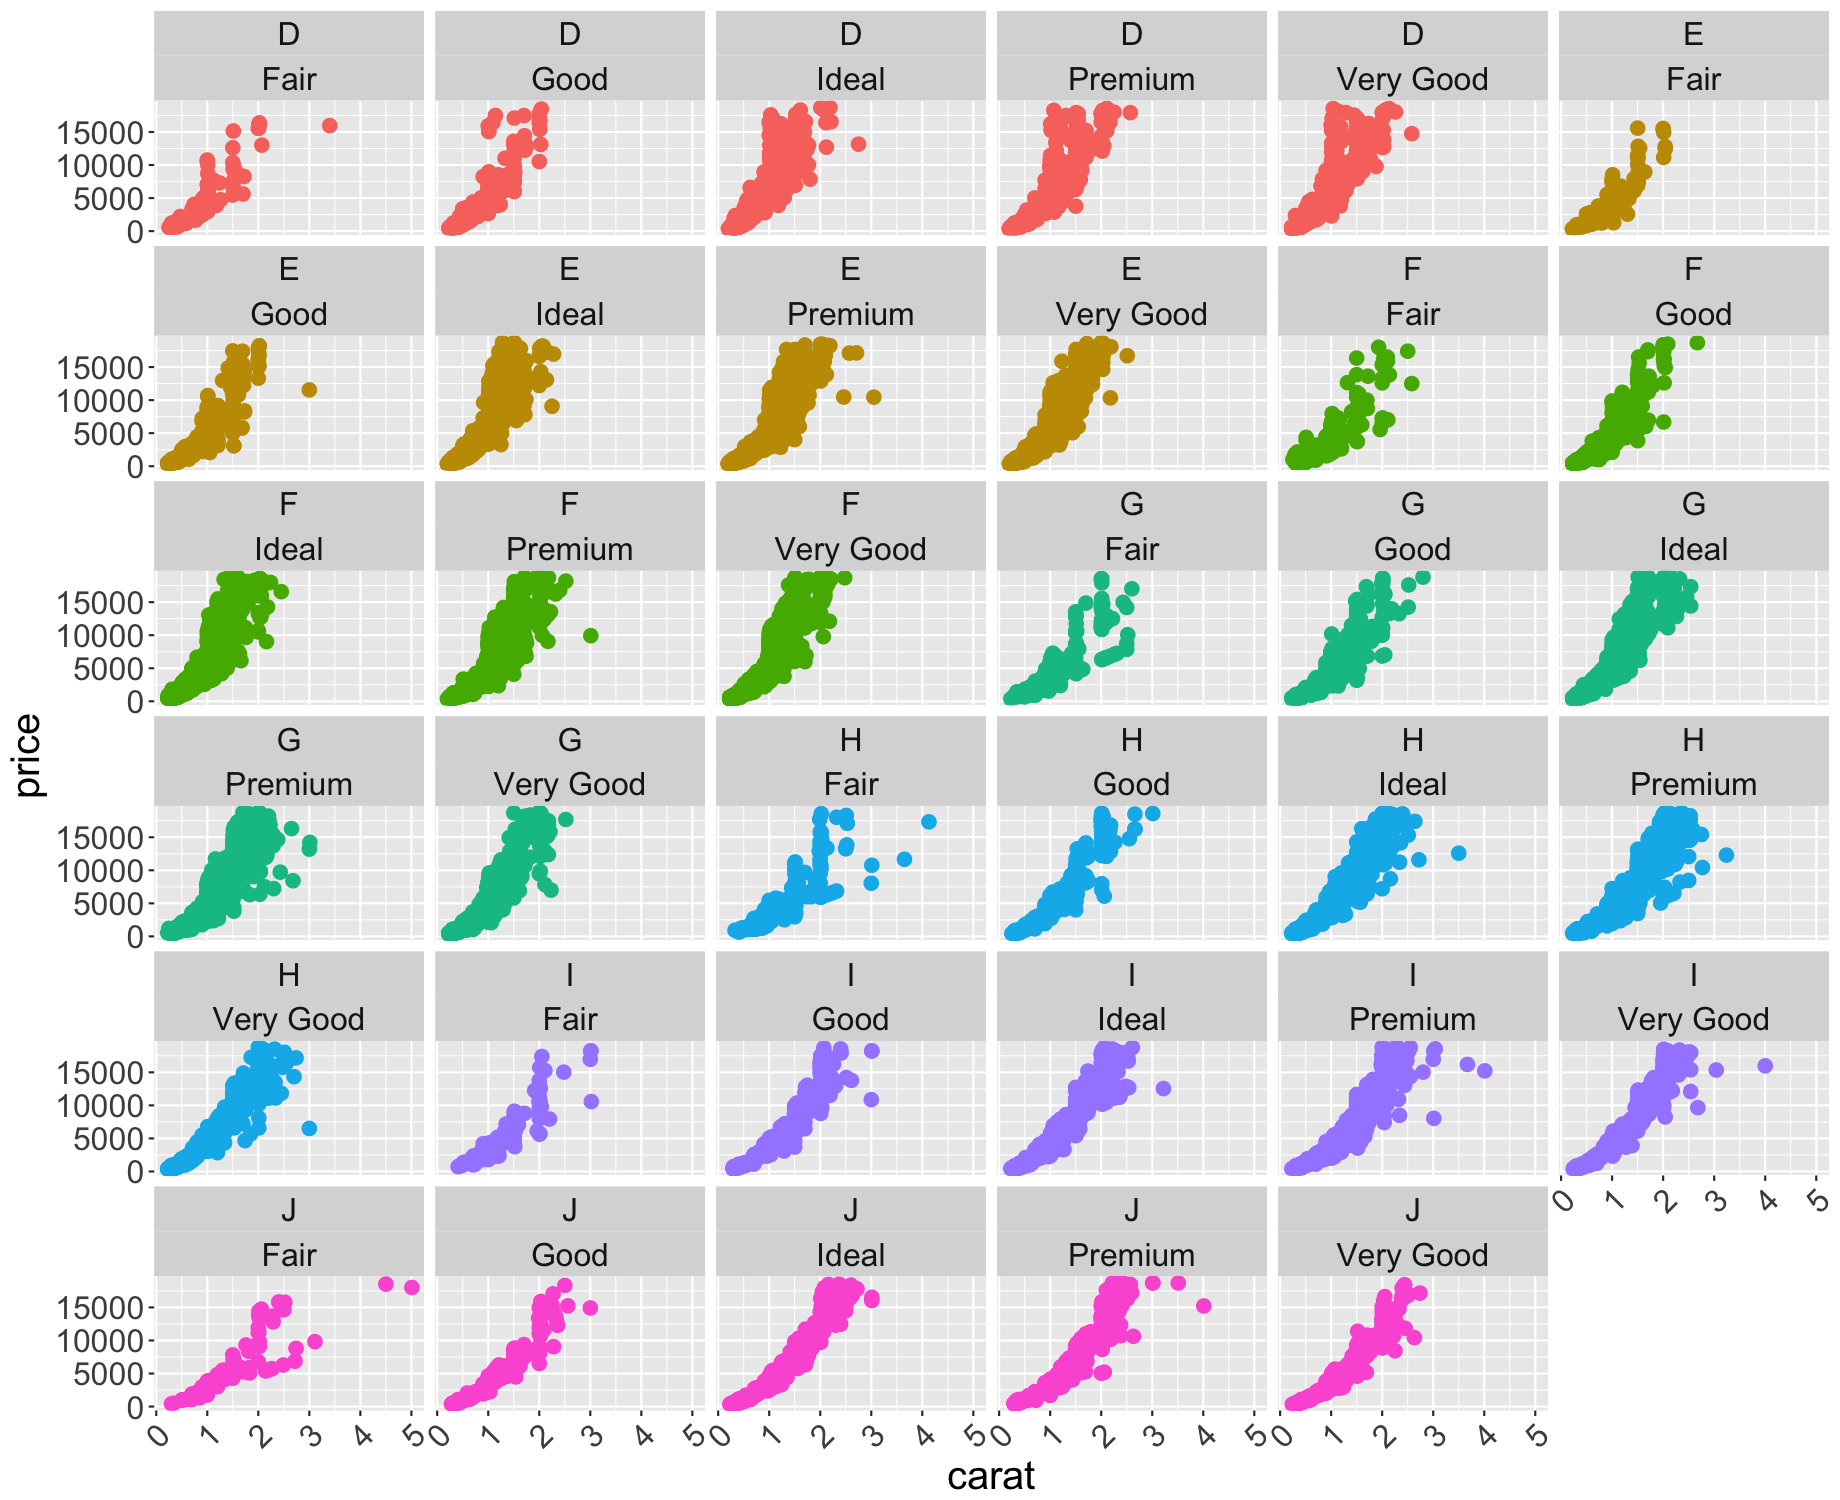
Step 3 - Define Facet Variables
Facet variables are categories in your data. For example, you want to see above Population Growth data by States of USA. Facet variables will appear at the top of each subplot. Second facet variable is the further subdivision of your data. In the Population Growth example, second facet variable could be the Sex, dividing the plots by Male and Female. In this way, you can generate plots from your data to see the trends with mutiple subdivision.
Step 4 - Present Your Plot
Most importantly, to present your plot in a Power Point or Word Document just right click, copy and paste it.